
Latest news from Edgeworks Creative and some of the things we find from around the web.
| Edgeworks Product | 9 |
| Content Creation | 4 |
| SEM | 11 |
| Design | 11 |
| Instructional Design | 3 |
| Props | 218 |
| Alphabet Soup | 33 |
| Creative Collaboration | 1 |
| Website Ownership | 5 |
| Services | 5 |
| Client Website | 29 |
| Edgeworks Office | 18 |
| Marketing | 18 |
| AI Assisted Post | 1 |
| SEO | 10 |
| This Day in History | 1 |
| Branding | 1 |
| Book Review | 1 |
| Q&A | 3 |
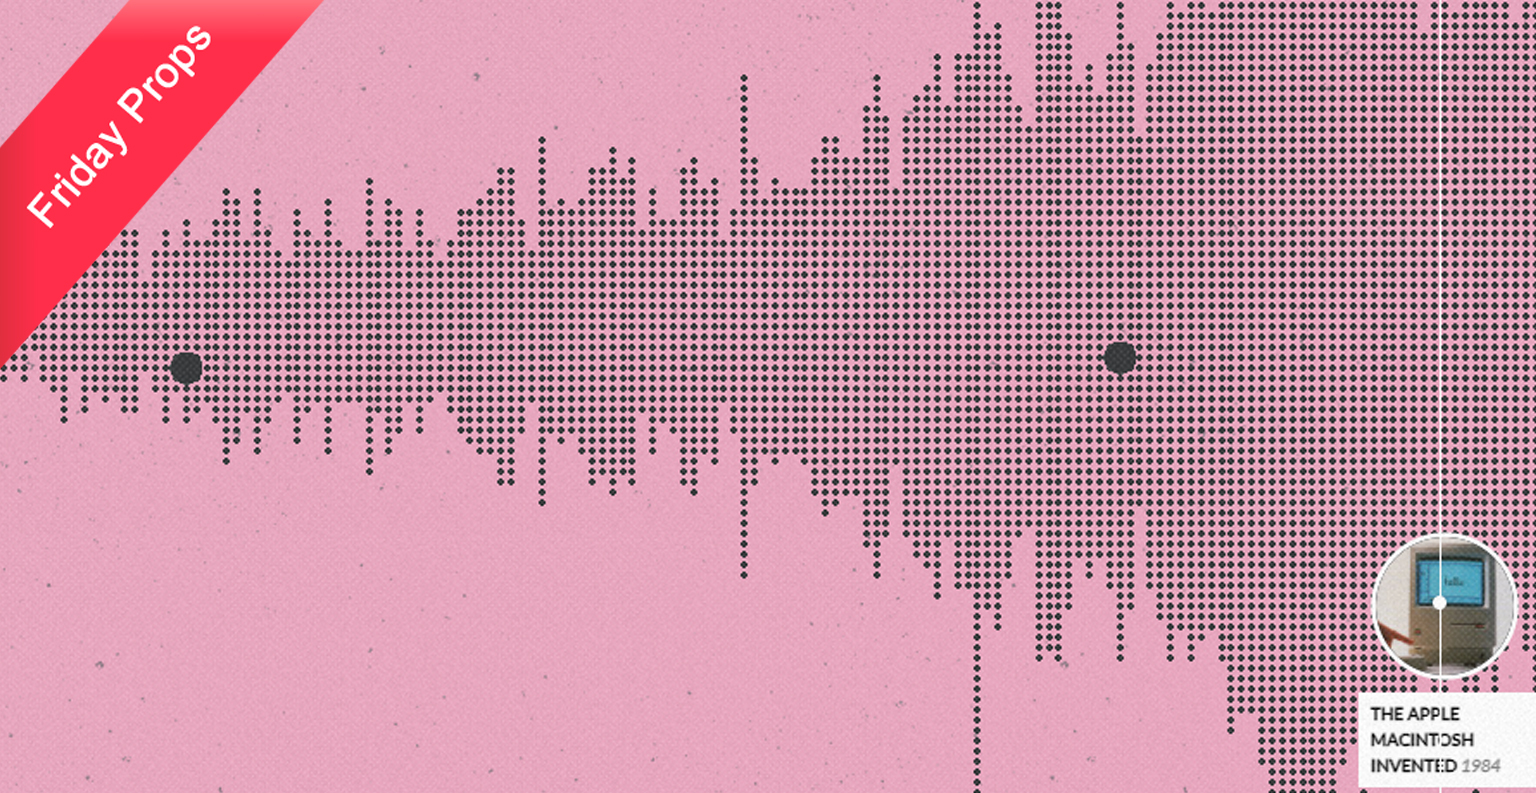
Friday Props this week going out to Historgraphy.io - an interactive timeline view of every historical event recorded in Wikipedia. This exploration of how to present four billion years of history is both fun to explore for the content itself, but also the user interface design.
The project allows users to filter the timeline by category and change the scale of the viewport to cluster more or fewer events - each represented by an individual dot on the screen. The hover event shows a popup circle window with an image representing the event and a title and date. It is best simply visited and explored than explained - once you see, you will see.
Histogroahy.io is the brainchild of Matan Stauber, and a graduate project for his studies in Visual Communication at Bezalel Academy of Art and Design, Israel’s national school of art.
Timelines are one of the most popular ways of visualizing history, but they are limited to a specific time period. Histography is an interactive timeline that allows viewers to explore all of history, across 14 billion years of history, all the way back to the Big Bang. The site draws historical events from Wikipedia and self-updates daily with newly recorded events. Every dot in Histography represents a historic event, along with videos, articles, and images. Viewers can adjust to any time range, from decades to billions of years, and even compare historic events using different categories, such as war and inventions in the Middle Ages.
excerpt from an interview with Smashing Magazine
Histography from Matan Stauber on Vimeo.
more on Matan Stauber: https://cargocollective.com/matanstauber
Bezalel Academy of Art and Design: www.bezalel.ac.il


